Figure 9.

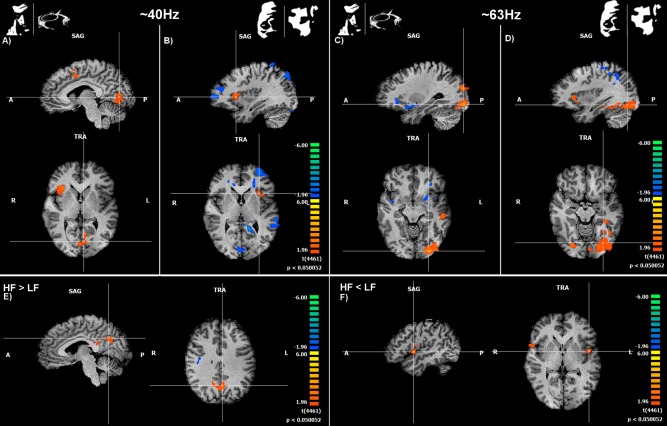
EEG‐informed fMRI evidence for different neural generators for distinct frequency bands, one related to visual processing (early visual areas) and the other to high level decision mechanisms (e.g., the insula). (A) and (B) show GLM maps based on gamma‐band regressors—low frequency (LF) for face + guitar objects (easily perceived) and inverted faces + scrambled conditions (not readily perceived), respectively. High frequency (HF) GLM maps are shown in (C) and (D). Note that group analyses showed different significantly activated regions as a function of frequency band. We found increased activity for decision related areas (anterior insula) mainly for the LF predictor (low gamma range; A) and B)). Visual areas activated in particular in response to higher Gamma oscillation predictors which are related to object perception (C) and scrambled conditions (D). (E): brain regions activated for the contrast HF > LF. (F): areas with increased modulation for the LF > HF contrast. Map threshold was set to P < 0.05 (corrected). See Table 1 for details regarding significant clusters sizes, and locations and statistics.
