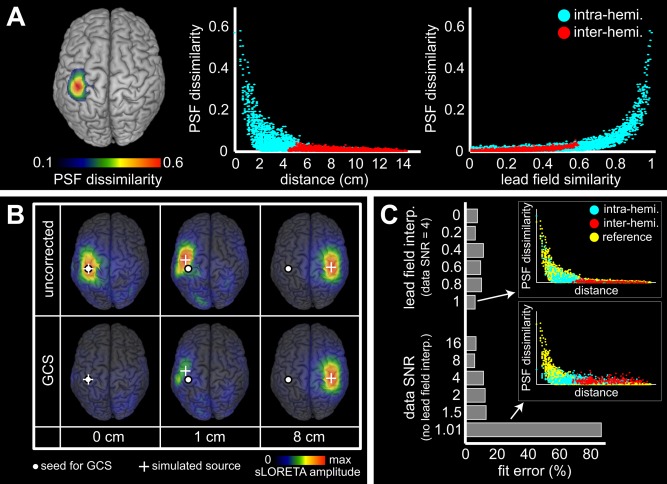
Figure 2.

Effect of the GCS from the left SM1ha on noisy PSFs. (A) Spatial distribution of PSF dissimilarity for the reference simulation (SNR , no lead field error). It is represented as a cortical map (left) and plotted against distance (middle) or lead field similarity (right) between the seed and the simulated node. Blue and red points respectively denote sources in the left and the right hemispheres. (B) Example PSFs before (top) and after (bottom) geometric correction taken from the reference simulation with simulated node (white cross) placed along the rolandic sulcus at 0, 1 and 8 cm from the seed (white dot). Maps were normalized using sLORETA for visualization. C: Effect of parameters variation on PSF dissimilarity, as assessed by the fit error to the reference simulation. Inserts show two examples with explicit comparison to the reference simulation (yellow points).
