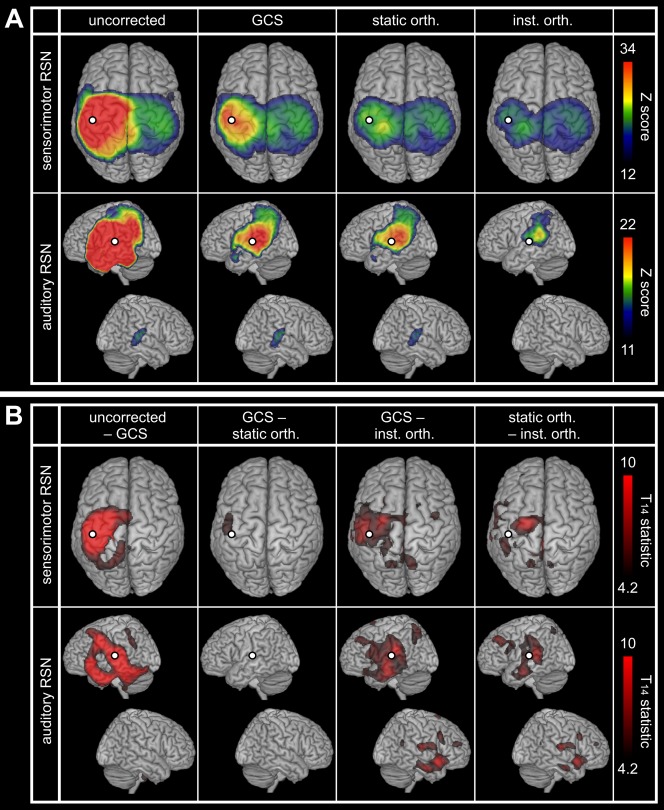
Figure 5.

Spatial leakage correction for RSNs. (A) Statistical mapping of significant SM1 (top) and A1 (down) slow envelope FC at rest without correction for spatial leakage, with the GCS, as well as with static and instantaneous orthogonalizations. The presented values of Z‐scores were group averaged and the upper scales were based on the GCS maps maximum. Statistical masking was derived from a conjunction analysis and lower scales were set to the within‐mask minimum. (B) Differential effects of spatial leakage corrections. Statistical thresholding was applied at FWE‐corrected significance level 0.05, and upper scales were set to the maximum of GCS−inst. orth. maps. In all cases, the white dot indicates the seed used for FC mapping and spatial leakage correction.
