
Figure 2.
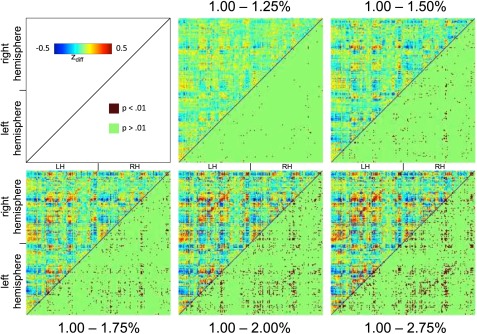
Functional connectivity differences between cortical regions across isoflurane levels. The upper triangle of each plot represents the z‐score values of that level's matrix (seen in Fig. 1) subtracted from the matrix at the 1.00% level. The lower triangle indicates whether the difference is significant (P < 0.01, uncorrected, two‐tailed t‐test). For region labels, see Supporting Information Figure 2. LH, left hemisphere; RH, right hemisphere. [Color figure can be viewed in the online issue, which is available at http://wileyonlinelibrary.com.]