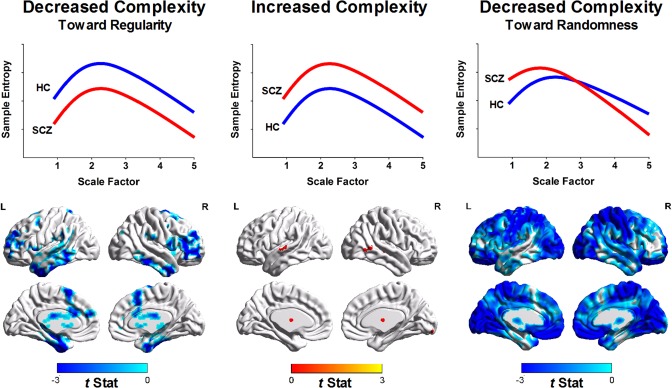
Figure 4.

Quantification of complexity changes in patients with schizophrenia (SCZ) relative to healthy controls (HC) according to MSE profiles. (Left) Brain regions with the regularity type of complexity changes of BOLD signals (i.e., decreased sample entropy over all scale factors in SCZ relative to HC). (Middle) Brain regions with increased complexity of BOLD signals (i.e., increased sample entropy over all scale factors in SCZ relative to HC). Color shown in brain mapping represents raw t‐statistics of difference of MSE profile between SCZ and HC. No significant brain cluster was observed in this type of complexity change after correction for multiple comparisons. (Right) Brain regions with the randomness type of complexity change (i.e., increased sample entropy in short time scales followed by decay of sample entropy as the scale factor increases).
