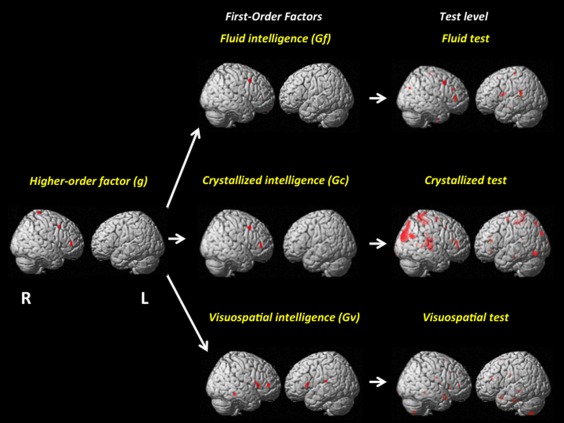
Figure 3.

Visual representation of the reversed hierarchy using GMV results at P < 0.001. The test level summarizes findings for the complete set by construct (Gf, Gc, and Gv). [Color figure can be viewed in the online issue, which is available at http://wileyonlinelibrary.com.]
