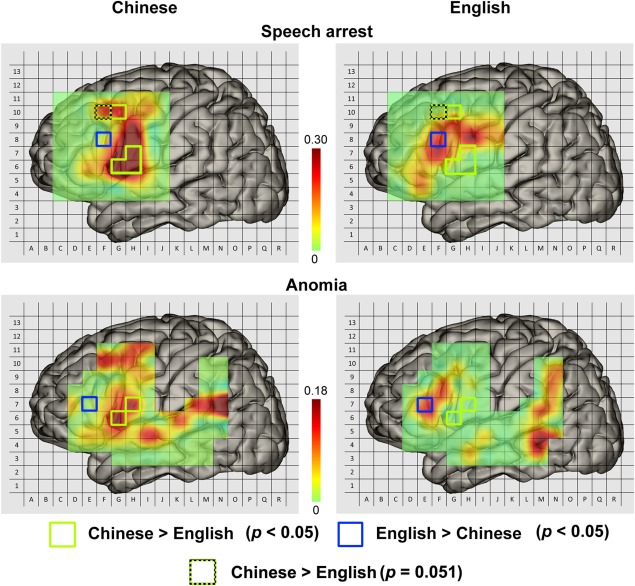
Figure 5.

Pseudo‐colored 2D probability maps for ISM positive regions in speech arrest and anomia conditions for Chinese and English data. The green and blue (dotted blue) squares outlined the significant difference in language production areas between Chinese‐speakers and English‐speakers. Please note that the figures in the right panels were modified according to the study by Sanai et al. [2008]. (With the permission from Dr. Berger).
