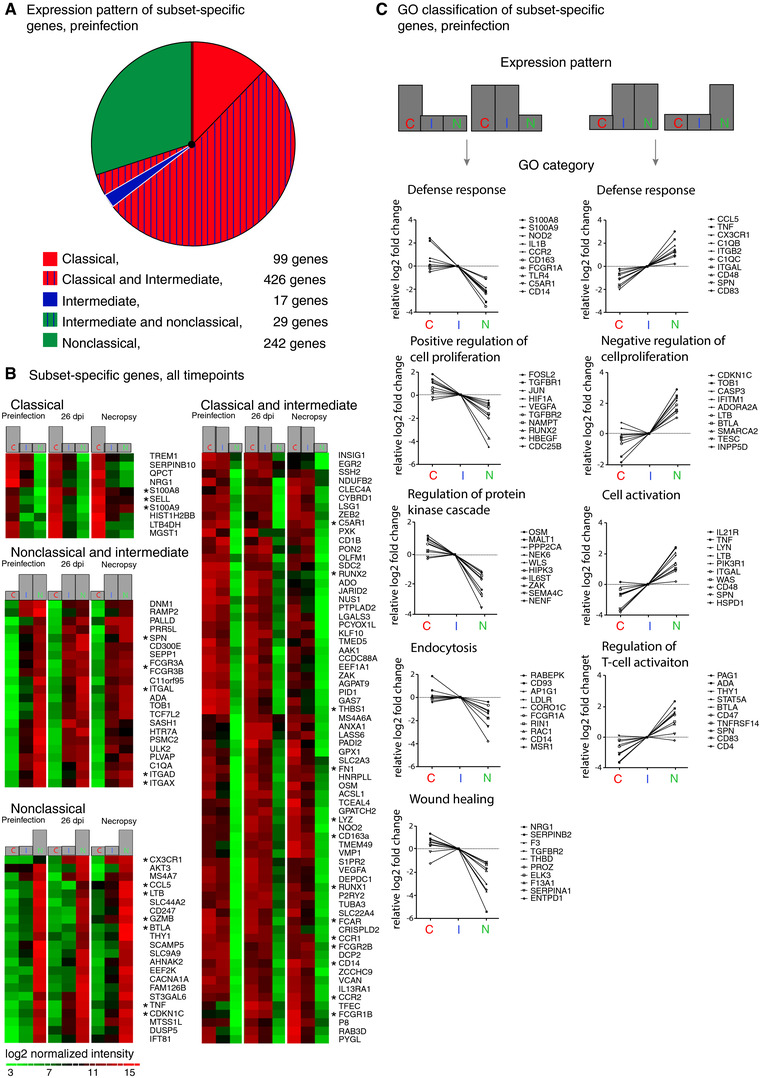
Figure 3.

Identification of subset‐specific genes reveals the putative functional character of monocyte subsets. (A) Eight hundred thirteen genes found to differentiate monocyte subsets in uninfected animals were grouped by expression pattern: classical (red), intermediate (blue), and nonclassical (green) monocytes. Striping indicates expression by two subsets. The size of each segment is proportional to the number of genes specific to the indicated subset(s). Nonclassical monocytes had more unique genes (242 genes) than classical monocytes (99 genes) and intermediate monocytes (17 genes); 426 genes were expressed by both classical and intermediate monocytes, and 29 genes were expressed by both nonclassical and intermediate monocytes. Classical and intermediate monocytes express a large number of the same phenotypic markers, while nonclassical monocytes are more dissimilar. (B) Heat maps of the 172 genes that differentiate the three monocyte subsets both preinfection and in SIV‐infected animals. Rows are the average normalized intensity for the gene indicated. Green indicates lower expression, and red indicates higher expression. Columns are the different monocyte subsets for each of the three infection time points. At all time points, 10 genes were expressed ≥2.0‐fold more by classical monocytes, 22 genes were expressed ≥2.0‐fold more by nonclassical monocytes, and two genes were expressed ≥2.0‐fold more by intermediate monocytes (data not shown) than by the other subsets. Additionally, 22 genes were expressed ≥2.0‐fold more by both intermediate and nonclassical monocytes compared to classical monocytes, and 116 genes were expressed ≥2.0‐fold more by both classical and intermediate monocytes compared to nonclassical monocytes; for simplicity only the top 70 genes are shown. Asterisks indicate genes of interest regarding macrophage immune function and phenotype. (C) Representative GO terms for biological processes associated with genes expressed ≥2.0‐fold by classical monocytes or both classical and intermediate monocytes (left panels) and nonclassical or both intermediate and nonclassical monocytes (right panels) prior to infection are shown. Gene expression values are the log2 transformed fold change in classical, intermediate or nonclassical monocytes normalized to expression in intermediate monocytes. Representative genes are shown for each cluster. Complete data for functional enrichment categories at each infection time point are presented in Table 2
