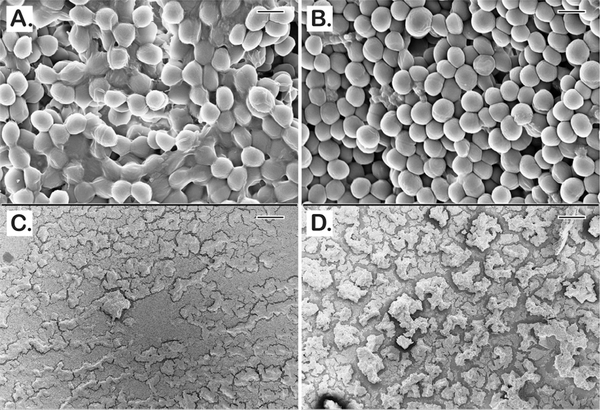
Figure 10.
Scanning electron micrographs of established MRSE 35984 biofilms (3 day old). The untreated control sample shows thick EPS enfolding every bacterial cell (A). BPEI-treated sample shows disrupted EPS and significant number of exposed cells without the EPS (B). At lower magnification, the untreated control (C) biofilms appear with full and tightly occupied biofilms, whereas the BPEI-treated sample (D) shows disjointed biofilms by many revealed surfaces. Scale bars (A,B) = 1 μm. Scale bars (C,D) = 100 μm.

