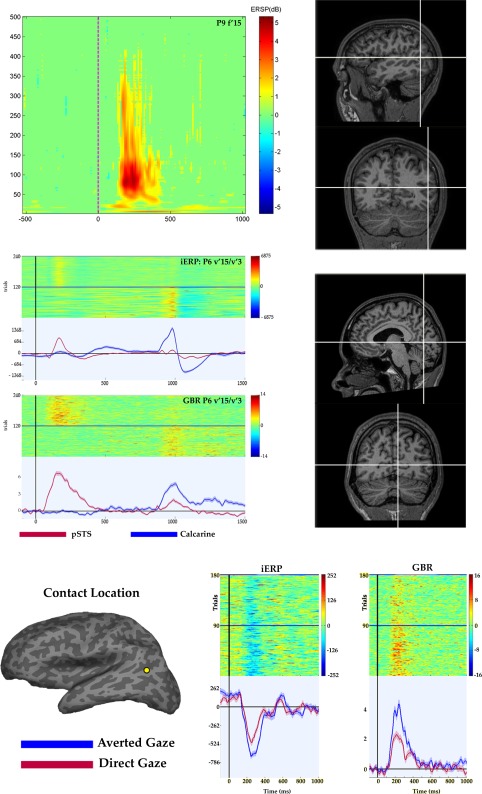
Figure 2.

Upper panel. TF map recorded during gaze shift observation in a representative patient. Time zero indicates the presentation of Image2. High‐frequencies up to 400 Hz are clearly modulated by gaze shift presentation. The precise anatomical localization of the contact is shown in both sagittal and coronal sections (right). Note the lack of GBR during the presentation of the fixation window, appearing at 800 ms after stimulus onset. Middle panel. Different recruitment of a contact located in the posterior temporal region (red) and one located in the calcarine fissure (blue), during gaze shift observation (time zero) and fix condition (800 ms after stimulus onset). Posterior temporal contact shows a clear iERP and GBR at 200 ms after gaze shift observation and a weaker response during the fix condition. In contrast, the contact located in the calcarine fissure is strongly recruited during the fix condition. The precise anatomical localization of the calcarine contact is shown in both sagittal and coronal sections (right). Lower panel. Result from a representative patient (P9) in the Averted gaze vs. Direct gaze comparison. The precise anatomical localization of the contact is visualized on the inflated brain of the patient (FreeSurfer®). Single trials (up) and average response (down) during the AG (blue) and DG (red) conditions are shown, for both iERP (μV) and GBR (dB).
