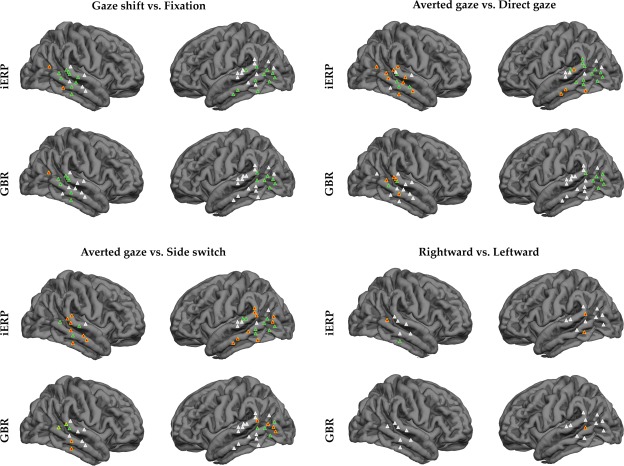
Figure 3.

Results of the repeated measures ANOVA (P < 0.05) applied to iERP and GBR, in the four statistical comparisons. Entrance points of the electrodes for each patient are plotted on a template brain (FreeSurfer®). Gaze shift vs. Fixation. GS>FX=green; FX > GS = orange; no response = white. Averted gaze vs. Direct gaze. AG > DG = green; nonsignificant differences = orange; no response = white. Averted gaze vs. Side switch. AG > SS = green; SS > AG = yellow; nonsignificant differences = orange; no response = white. Rightward vs. Leftward. RG > LG = green; LG > RG = orange; nonsignificant = white.
