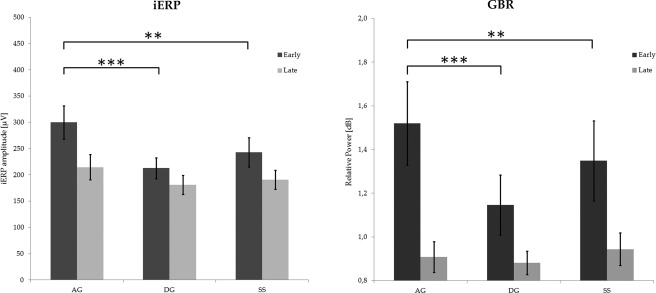
Figure 4.

Statistical analysis conducted on both iERP (left) and GBR (right) values recorded by all electrodes exploring the posterior temporal region. Values were computed as the maximum absolute amplitude (iERP) and power (GBR) within two different time windows (early 0–400 ms; late 400–800 ms). In both cases, the CONDITION*TIME interaction was significant. Horizontal bars indicate significant post‐hoc between early values (**P < 0.001; ***P < 0.0001). No significant differences were found between late values. All early values were significantly higher than late ones (not shown in the figure). Error bars indicate standard error.
