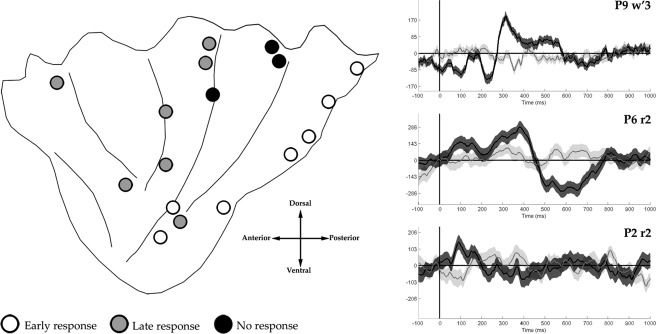
Figure 6.

Left panel. Insula results of the repeated measures ANOVA (P < 0.05) applied to iERP in the Gaze shift vs. Fixation comparison. Contacts' positions are plotted on a schematic illustration of the insula [modified from Stephani et al., 2011]. For the sake of comparison all of the contacts were plotted in a left hemisphere. Right panel. Representative samples of iERPs showing an early response (up), a late response (center) and no response (down) during the gaze shift (black) vs. fixation (gray) conditions.
