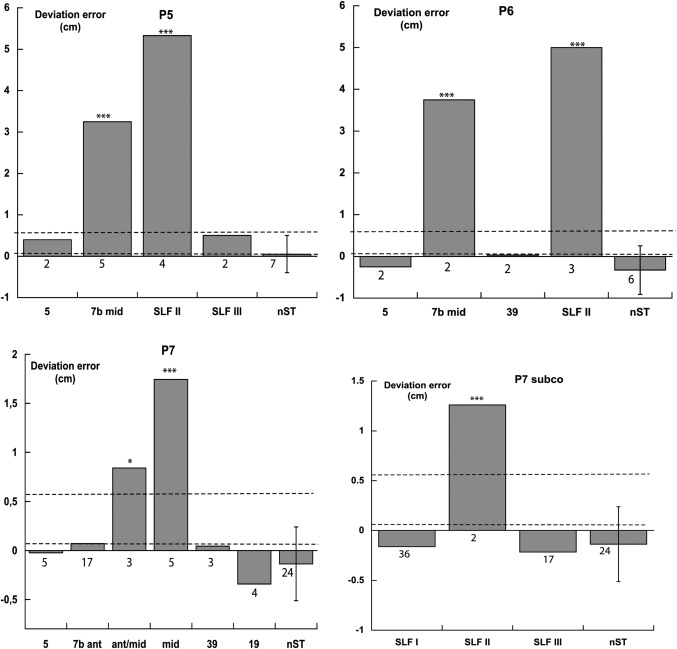
Figure 4.

Patients P5, P6, and P7. Deviations in cm in line bisection. Each column refers to a stimulated brain region (BAs 5, 7, 39, 19; SLF I–III). nST trials, dashed horizontal lines (range of the bisection error of ten neurologically unimpaired participants using their right hand), and t tests as in Figure 3.
