
Figure 1.
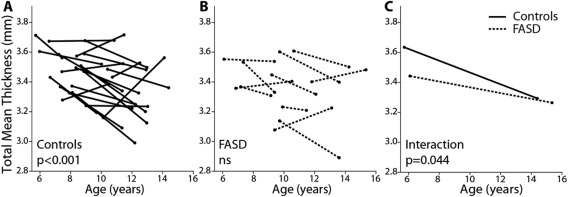
Total mean thickness by group. Leftmost plots (A and B) show thinning trajectories of control subjects (solid lines) and FASD subjects (dotted lines) by age. A significant effect of age is found in the controls (P < 0.001) but not the FASD group (ns). A significant age‐by‐group interaction (C) (P = 0.044) indicates a difference in the rate of thinning between groups, with controls undergoing steeper rates of age related thinning than FASD participants.