
Figure 2.
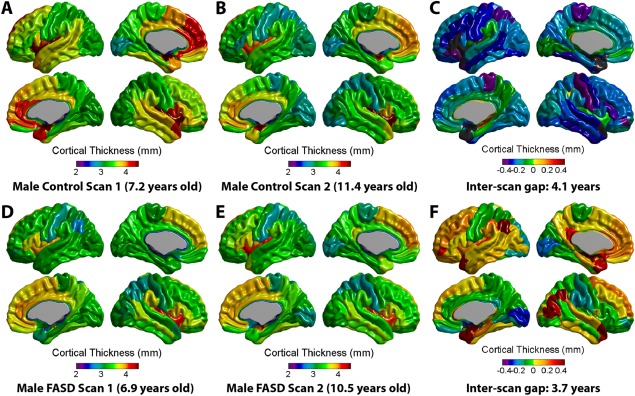
Examples of individual subject cortical thickness maps. Top panel (A–C) displays cortical thickness maps at scan 1 (7.2 years) and scan 2 (11.4 years) as well as the difference map (scan 2—scan 1, gap = 4.1 years) for a male control participant. Below (D–F) is an example of a male FASD participant aged 6.9 years at first scan and 10.5 years at second scan (inter‐scan gap = 3.7 years). Although general patterns of cortical morphology are similar between these two individuals, the control participant has a thicker cortex in many areas at both scans, and undergoes more thinning (areas in blue, purple, or green on far right) between scans. Of note, several areas in the FASD subject appear to lack cortical thinning, but rather show little change or even increases in thickness between scans. [Color figure can be viewed in the online issue, which is available at http://wileyonlinelibrary.com.]