
Figure 5.
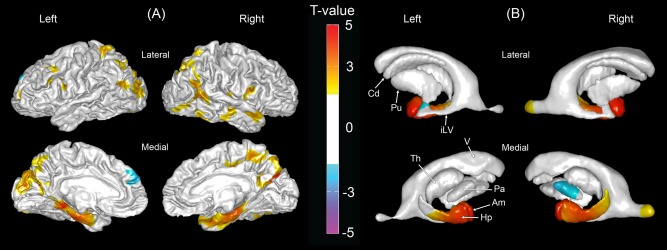
Morphological comparisons between the Alzheimer's disease (AD) and moderate to severe vascular cognitive impairment (MSVCI) groups. (A) Statistical map of cortical thickness. Warmer color indicates more severe cortical thinning and cooler color indicates greater cortical thickness in the MSVCI group as compared to the AD group. (B) Statistical map of subcortical shapes. Warmer color indicates more severe subcortical shrinkage and cooler color indicates greater subcortical expansion and enlargement in the MSVCI group as compared to the AD group. Am, amygdala; Cd, caudate; Hp, hippocampus; iLV, inferior lateral ventricle; Pa, globus pallidus; Th, thalamus; V, ventricle. [Color figure can be viewed in the online issue, which is available at http://wileyonlinelibrary.com.]