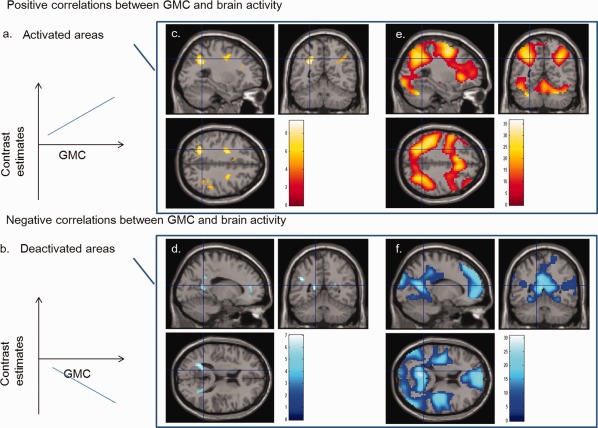
Figure 1.

Patterns confirming to the statement “the greater the GMC, the greater the task‐related activation increase/task‐related activation decrease” (or the greater the task‐related activation change from baseline). (a) A schematic of positive correlation between GMC and brain activity in activated areas (the greater the GMC, the greater the task‐related activation increase). (b) A schematic of negative correlation between GMC and brain activity in deactivated areas (the greater the GMC, the greater the task‐related activation decrease). (c) Regions with a significant positive correlation between brain activity during the 2‐back task and GMC (P < 0.05, corrected for voxel‐level FWE). The regions with correlation were overlaid on a single subject T 1 image of SPM5. GMC was significantly and positively correlated with brain activity during the 2‐back task in the anatomical cluster around the left inferior parietal lobule together with other regions. (d) Regions with significant negative correlations between brain activity during the 2‐back task and GMC (P < 0.05, corrected for voxel‐level FWE). The regions with correlations were overlaid on a T 1 SPM5 image of a single subject. GMC was significantly and negatively correlated with brain activity during the 2‐back task in the anatomical cluster that spread around the left precuneus together with other regions. (e) Regions that were activated during the 2‐back task are displayed at a height threshold of 0.05, corrected for voxel‐level FWE. Note that the voxels of positive correlation observed in (c) are included in the regions that were activated during the 2‐back task. (f) Regions that were deactivated during the 2‐back task are displayed at a height threshold of 0.05, corrected for voxel‐level FWE. Note that the regions with a negative correlation observed in (d) are largely located at the borders of the regions that were deactivated during the 2‐back task.
