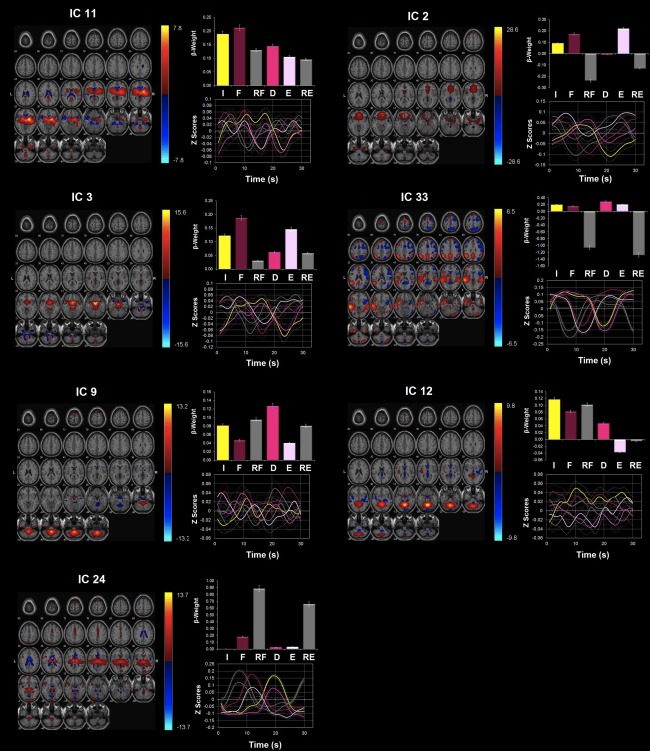
Figure 6.

Network modulations during the HIGH‐PREFILL WARM condition. Seven ICA components were highly upregulated during the HIGH‐PREFILL WARM condition (P < 0.05, uncorrected): ICs 11, 2, 3, 33, 9, 12, and 24. All were identified from ICA with regions with positive (warm color) and negative (cool color) signal change shown on the MNI T1 template (right = right). The color bar indicates t values. For each ICA component, the β‐weights and event averages of I (infusion), F (filled), RF (rating after filled), and D (drainage), E (emptied), and RE (rating after emptied) trials are demonstrated. [Color figure can be viewed in the online issue, which is available at http://wileyonlinelibrary.com.]
