
Figure 8.
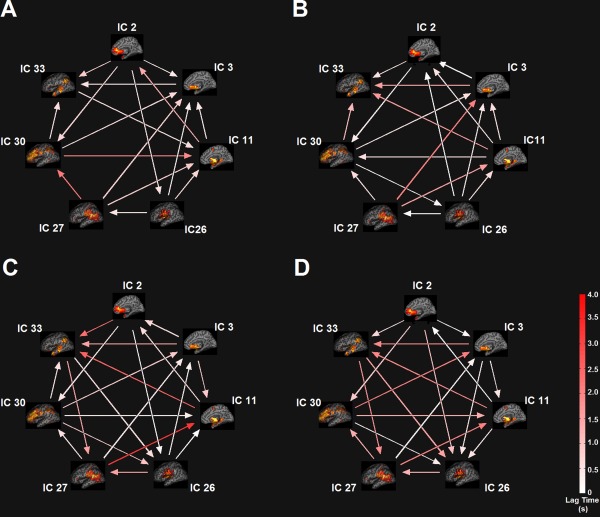
Functional Network Connectivity (FNC) between the task‐related networks. (A) The NO‐PREFILL WARM condition; (B) The NO‐PREFILL COLD condition; (C) The LOW‐PREFILL WARM condition; (D) The HIGH‐PREFILL WARM condition. Arrow represents a significant correlation between a network pair (P < 0.05, FDR‐corrected). The direction of the arrows indicates the time lag between the pairs. Color bar shows lag in seconds. [Color figure can be viewed in the online issue, which is available at http://wileyonlinelibrary.com.]