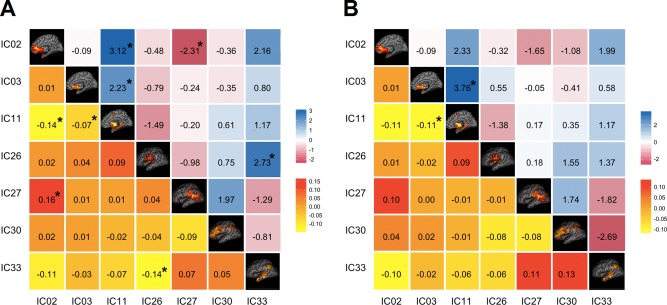
Figure 10.

FNC difference between task‐related network pairs between task conditions. (A) The NO‐PREFILL WARM and the LOW‐PREFILL WARM condition pairs; (B) The NO‐PREFILL WARM and the HIGH‐PREFILL WARM condition pairs. The lower half of matrix is the mean correlation difference between network pairs between two tasks. The upper half is the t‐value resulting from paired t‐test with FDR corrected P‐value of 0.05. The black asterisk indicates the pairs surviving the t‐test with an FDR‐corrected P‐value. [Color figure can be viewed in the online issue, which is available at http://wileyonlinelibrary.com.]
