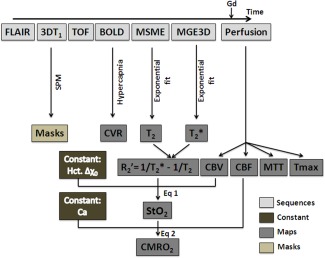
Figure 1.

Diagram of the acquisition and processing schemes to obtain CVR, perfusion, and oxygenation maps. FLAIR, fluid attenuated inversion recovery; TOF, time of flight; BOLD, blood oxygen level dependent; MSME, multi spin‐echo; MGE3D, 3D multi gradient echo; SPM, statistical parametric mapping; CVR, cerebral vasoreactivity; CBV, cerebral blood volume; CBF, cerebral blood flow; MTT, mean transit time; Tmax, time‐to‐maximum; StO2, tissular oxygen saturation; CMRO2, cerebral metabolic rate of oxygen; Gd, gadolinium‐DOTA; Hct, hematocrit; Δχ 0, change in magnetic susceptibility between oxy and deoxyhemoglobin; Ca, arterial oxygen content. CBV and CBF are obtained from the basal perfusion study. StO2 is derived from R and CBV. CMRO2 is derived from StO2 and CBF. CVR is an independent estimate.
