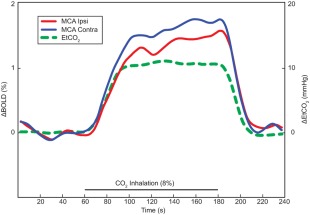
Figure 2.

Regressor used for fMRI analyses based on mean EtCO2 variation time courses during hypercapnia (green line). Percentage of BOLD signal averaged over three blocks. Mean BOLD signal time courses of MCA territories ipsilateral and contralateral to the SIAS were represented by red and blue lines, respectively. Both amplitude and initial slope of the BOLD time course decreased in the MCA territory ipsilateral to the SIAS.
