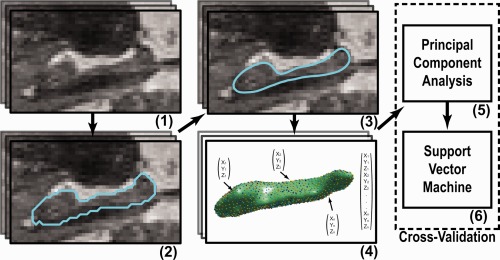
Figure 1.

Overview of methods used: (1) MRI scans of the brain were acquired. (2) In each scan, the left and right hippocampus was segmented. (3) The segmentations were postprocessed. (4) Points were distributed over each surface, such that points on a different scans correspond with each other, and were concatenated to create one feature vector per scan. (5) The dimensionality of the feature vectors was reduced using principal component analysis. (6) A Support Vector Machine classifier was used to predict dementia development for each scan. Step (5) and (6) were performed in a cross‐validation manner (for a colored delineation in the figure, refer to the web version of this article.) [Color figure can be viewed in the online issue, which is available at http://wileyonlinelibrary.com.]
