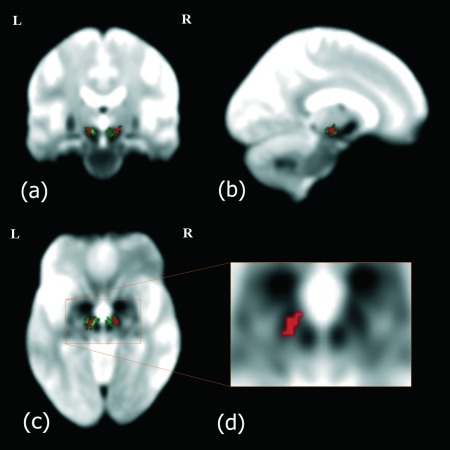
Figure 1.

T2*‐weighted group mean image: (a) coronal, (b) sagittal, and (c) axial orientations. The STN can be visualized as a hypointense area located ventro‐lateral to the rostral portion of the red nucleus [see the magnified view in (d)]. The STN atlas (in green) and the STN mask used as seed (in red) have been overlaid on the anatomical image. The STN mask was delineated manually to include hypointense areas comprised within the probabilistic STN atlas. The images are displayed in neurological orientation.
