
Figure 4.
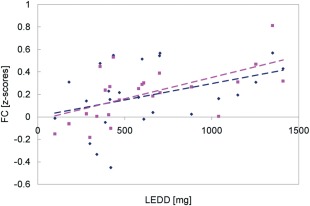
Correlation between the FC strength of the STN with the left motor cortex (y‐axis) and the levodopa dose (x‐axis), across the patient group. Right STN values are shown in pink, while left STN values are shown in blue.
Official websites use .gov
A
.gov website belongs to an official
government organization in the United States.
Secure .gov websites use HTTPS
A lock (
) or https:// means you've safely
connected to the .gov website. Share sensitive
information only on official, secure websites.
Correlation between the FC strength of the STN with the left motor cortex (y‐axis) and the levodopa dose (x‐axis), across the patient group. Right STN values are shown in pink, while left STN values are shown in blue.