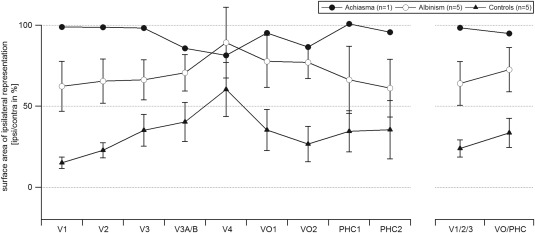
Figure 3.

Relative surface area of the ipsilateral representation. The respective correlation coefficients are given as a function of visual area for controls, albinism, and achiasma (mean ± SEM). Statistics were computed for the visual area groups V1/2/3 and VO/PHC as detailed in Methods section. The control group and the albinotic group differ significantly, but independent of visual area group as detailed in Results. For expansion of the area labels see Figure 1.
