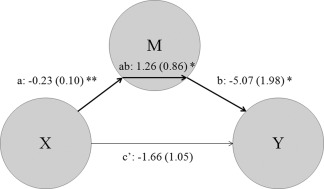
Figure 4.

Path diagram showing the relationships between maturity fears (X), percentage of unfair offers accepted (Y), and insula activation (M) during the UG task in excess weight participants. X was inversely related to M (a, or the brain‐trait pathway), while M was also inversely related to Y (b, or the brain‐state pathway). X was not directly related to Y (c'), but these two measurements were indirectly related through M (a*b). *P < 0.05, **P < 0.01.
