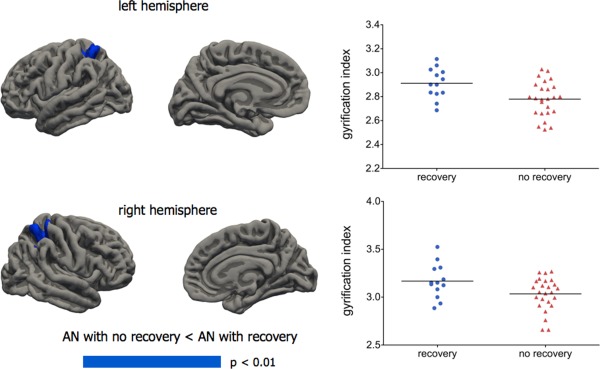
Figure 2.

Vertex‐wise comparisons between acute AN patients who subsequently recovered at 3‐year follow‐up (n = 13) and those who still had an eating disorder at follow‐up (n = 24). General linear models with age, duration of illness, and total intracranial volume were used, applying the Monte Carlo method to control for multiple comparison and using a cluster‐wise threshold for inclusion of P < 0.01. Graphs show individual mean gyrification values in areas of significant difference. Left hemisphere: a cluster of 897 mm2 with a vertex of maximum difference (P = 0.02) in the superior parietal cortex (−17, −49, 62). Right hemisphere: a cluster of 1.993 mm2 with a vertex of maximum difference (P = 0.0002) in the postcentral gyrus (27, −38, 51). No cluster showed significant results in the opposite direction. [Color figure can be viewed in the online issue, which is available at http://wileyonlinelibrary.com.]
