Figure 1.

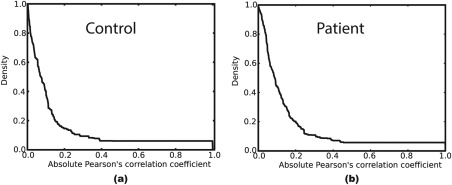
The thresholding relationship between the absolute value of Pearson's correlation coefficient and its corresponding graph density applied to a (a) control's and (b) patient's adjacency matrix. The figure clearly shows that higher correlation thresholds lead to a less dense graph.
