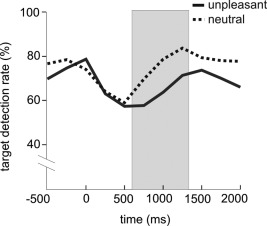
Figure 2.

Time course of target detection rates across all subjects in trials with neutral (dotted line) or unpleasant background images (solid line). Gray box indicates time window with significant differences in target detection rates between the two conditions.
