
Figure 3.
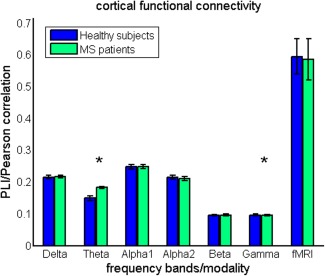
Cortical functional connectivity. Mean cortical functional connectivity (i.e., averaged over cortical ROIs and epochs [MEG]) is compared between groups. Note the significantly higher functional connectivity in the theta band for MS patients and lower functional connectivity in the gamma band in MS patients. Comparison for fMRI based cortical functional connectivity revealed no significant group differences. [Color figure can be viewed in the online issue, which is available at http://wileyonlinelibrary.com.]