
Figure 6.
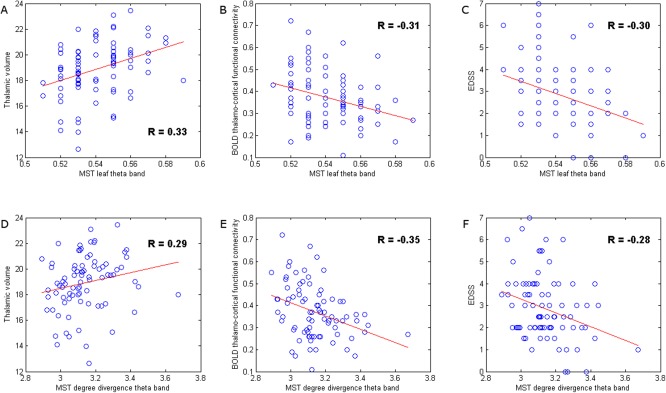
Correlation analysis. These scatter plots illustrate the relationship between disruption of cortical functional network topology in the theta band with other pathological characteristics of the disease, such as thalamic atrophy and increased BOLD thalamo‐cortical functional connectivity, and with clinical status in MS (EDSS). Although other network measures were also related to thalamic pathology and clinical status, we illustrate that two network measures itself were related to both thalamic pathology and clinical status. MST leaf fraction in the theta band in MS patients was positively correlated to thalamic volume (A), but negatively correlated to BOLD thalamo‐cortical functional connectivity (B) and EDSS (C). Similarly, MST degree divergence in the theta band in MS patients was positively correlated to thalamic volume (D), but also negatively correlated to BOLD thalamo‐cortical functional connectivity (E) and EDSS (F), that is, general decrease in the degree of nodes seemed to be a sign of damage. [Color figure can be viewed in the online issue, which is available at http://wileyonlinelibrary.com.]