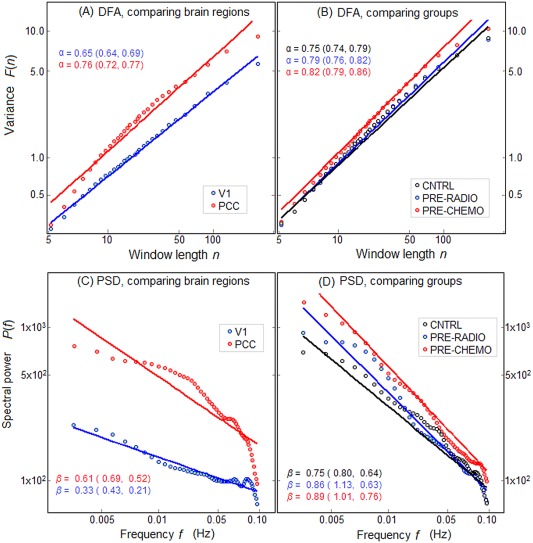
Figure 2.

Mean power versus time‐scale plots shown on log–log scale, for different ROIs. A,B: Plot variance F(n) versus time window size n, as estimated for DFA. The slope of a linear fit α and Bootstrapped 95% CIs are also given. C,D: Plot of spectral power P(f) versus frequency f, along with the negative slope of a linear fit β and Bootstrapped 95% CIs. Left‐side plots (A,C) compare scaling behavior between different brain regions of primary visual cortex (V1) and posterior cingulate (PCC). Right‐side plots (B,D) compare scaling behavior of different patient groups, for representative left middle frontal (LMF) ROI. [Color figure can be viewed in the online issue, which is available at http://wileyonlinelibrary.com.]
