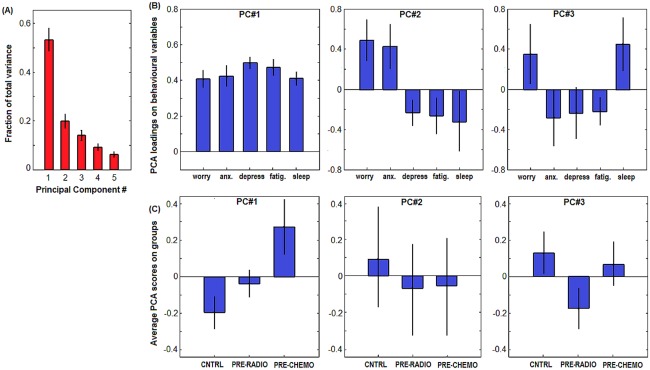
Figure 3.

PCA of the 5 self‐report measures of stress: Worry, Anxiety (Anx.), Depression (Depress.), Fatigue (Fatig.), and Sleep problems (Sleep). A: bar plots of mean PCA eigenspectrum, indicating fraction of total variance explained by each PC, with Bootstrapped Standard Error (SE) error bars (1,000 resampling iterations). B: bar plots of mean behavioral loadings for PCs #1–3, with SE error bars. C: mean subject scores on each PC, as a function of cancer group. CNTRL = control, PRE‐RADIO = pre‐radiotherapy, PRE‐CHEMO = pre‐chemotherapy, with SE errorbars. [Color figure can be viewed in the online issue, which is available at http://wileyonlinelibrary.com.]
