
Figure 4.
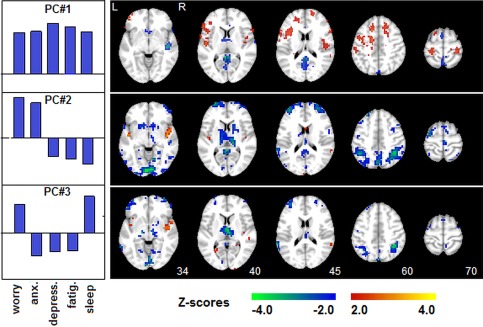
PLS analysis of distress measures versus Hurst exponent brain maps. A cross‐validated behavioral PLS is shown for subject loadings on each PC (shown in Figure 3B), against Hurst exponent brain maps (mean maps shown in Fig. 1). PCs #1–3 had significantly stable behavioral relationships. Each Z‐scored map shows regions where Hurst scaling is correlated with behavioral PC expression, displayed on the left (red = positive correlation; blue = negative correlation). Self‐reported behavioral measures include: Worry, Anxiety (Anx.), Depression (Depress.), Fatigue (Fatig.), and Sleep problems (Sleep). [Color figure can be viewed in the online issue, which is available at http://wileyonlinelibrary.com.]