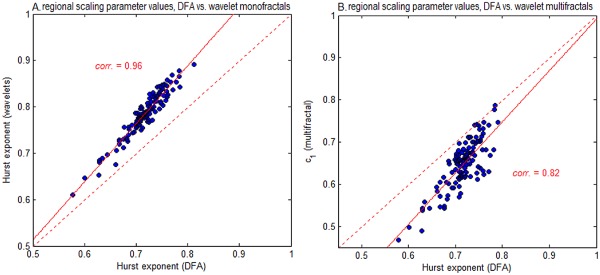
Figure 6.

Comparing regional scaling for different fractal estimators. We plot average fractal scaling values of the 116 AAL atlas ROIs, comparing H of DFA, against (A) H of monofractal wavelet estimator, and (B) c 1 of multifractal wavelet estimation. Each point denotes the average scaling exponent over all subjects, computed from a 4‐voxel ROI at the center of each AAL template region. [Color figure can be viewed in the online issue, which is available at http://wileyonlinelibrary.com.]
