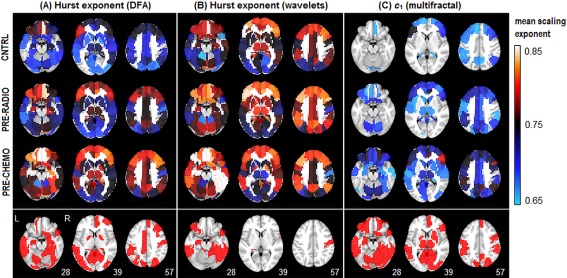
Figure 7.

Comparing between‐group differences for different fractal estimators. We plot average fractal scaling estimates of the 116 AAL atlas ROIs for (A) DFA, (B) monofractal wavelets, and (C) multifractal wavelets. We plot (top) average scaling exponent computed on a 4‐voxel ROI at the center of each AAL template region, and (bottom) Bootstrap significance plot, indicating areas of significant difference in PRE‐CHEMO > CNTRL, for False‐Discovery Rate FDR = 0.05 threshold. No regions showed significant change in the opposite direction (i.e., PRE‐CHEMO < CNTRL). [Color figure can be viewed in the online issue, which is available at http://wileyonlinelibrary.com.]
