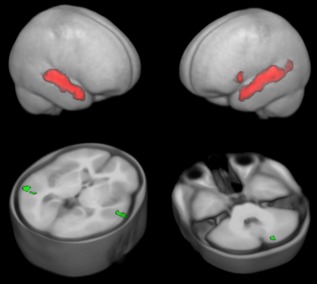
Figure 1.

BSD: top panels: whole‐group activation pattern in conventional, second‐level random effects analyses, rendered on the custom‐made gray matter prior, thresholded at P = 0.01, FWE‐corrected; bottom panels: activation difference (PT > TD), overlaid on the custom‐made T1 reference dataset, thresholded at P = 0.001, uncorrected. Note only minor group activation differences. [Color figure can be viewed in the online issue, which is available at http://wileyonlinelibrary.com.]
