
Figure 3.
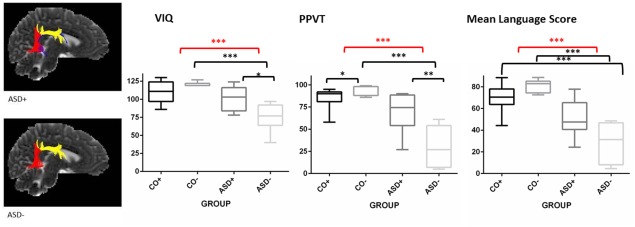
A boxplot representation of the VIQ, scores on the PPVT, and mean language score on the CELF‐4NL in bilateral control (CO+) and ASD (ASD+) children and left‐hemispheric unilateral control (CO−) and ASD children (ASD−). The central line of the box represents the median value for each subject group. The T‐bars that extend from the boxes relate to the minimum and maximum values. The red line represents a significant interaction effect (group × AF). The black lines show post hoc t‐tests with Bonferroni correction (*P < 0.05; **P < 0.01; ***P < 0.001).