
Figure 4.
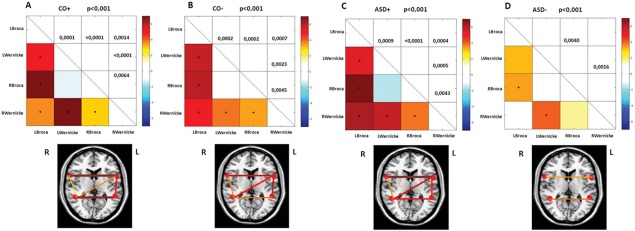
Correlation matrices representing functional connectivity links of the language network for both CO groups and ASD groups. The color represents the T‐value of connectivity between two connected brain regions. Significant correlations at P < 0.001 uncorrected are indicated with a dot at the center of the matrix square. P values are given for the significant correlations. Below each correlation matrix, significant correlations are schematically represented as lines on an axial slice. Line thickness and color vary according to the scale above. LBroca = Left Broca; RBroca = Right Broca; LWernicke = Left Wernicke; RWernicke = Right Wernicke.