
Figure 2.
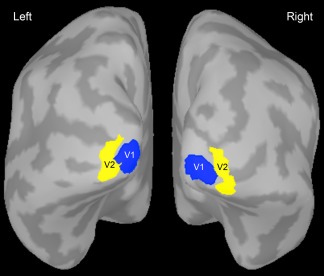
Inflated surface mesh of one participant's cortex showing the regions of interest used for time‐frequency analyses. The V1 and V2 ROIs were both limited to the occipital pole. The regions of interest were defined for each participant's anatomical data using parcellation atlases from FreeSurfer.