
Figure 6.
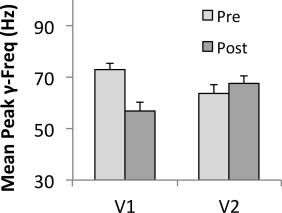
Bar chart showing mean peak frequencies in V1 and V2 before and after a button press during perceptual rivalry. The plot shows the interaction between region of interest and time of activity relative to the button press: while peak frequencies in V1 are higher before a button press compared to after the press, there is no such difference observed in V2.