
Figure 8.
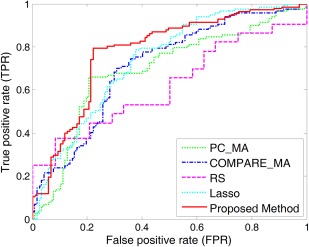
ROC curves for the classification between p‐MCI and s‐MCI achieved by different methods. [Color figure can be viewed in the online issue, which is available at http://wileyonlinelibrary.com.]
Official websites use .gov
A
.gov website belongs to an official
government organization in the United States.
Secure .gov websites use HTTPS
A lock (
) or https:// means you've safely
connected to the .gov website. Share sensitive
information only on official, secure websites.
ROC curves for the classification between p‐MCI and s‐MCI achieved by different methods. [Color figure can be viewed in the online issue, which is available at http://wileyonlinelibrary.com.]