
Figure 10.
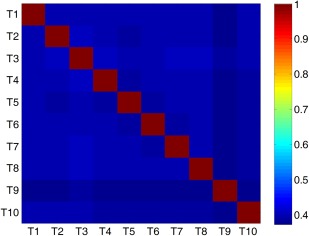
Correlation coefficients among ten atlases computed according to Eq. (7). Here, red and yellow indicate high correlation coefficients, while blue and green denote low coefficients. [Color figure can be viewed in the online issue, which is available at http://wileyonlinelibrary.com.]