
Figure 11.
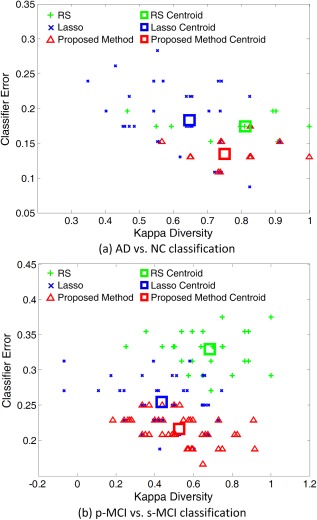
The diversity‐error diagrams of classifiers in (a) AD versus NC classification and (b) p‐MCI versus s‐MCI classification using RS, Lasso and our proposed method. The final ensemble is composed of ten classifiers. The x‐axis represents the diversity of a pair of classifiers evaluated by the kappa measure, and y‐axis represents the average classification error of a pair of classifiers. The green, blue and red squares denote the centroids of RS, Lasso, and our proposed method classifier clouds, respectively. [Color figure can be viewed in the online issue, which is available at http://wileyonlinelibrary.com.]