
Figure 3.
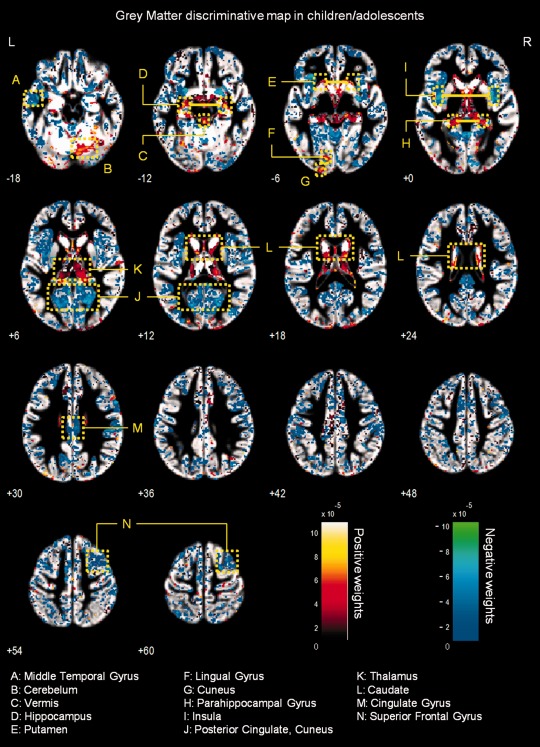
Whole‐brain representation of the discriminative map for GM relative volume classification in children/adolescents. The weight vectors are displayed from a leave‐two‐out linear SVM using 150,000 voxels. Positively weighted voxels in NF1 vs. controls are displayed in red/yellow, while negatively weighted voxels are displayed in blue/green. Regions with relatively stronger classification absolute weights are identified. The map is overlayed on the group GM template from all subjects. The z‐coordinate for each axial slice in the standard MNI space is given.