
Figure 8.
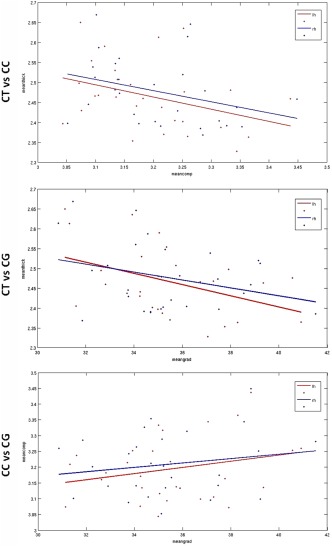
Scatter plots for correlations between CT and CC (upper row), CT and CG (middle row), CG and CC (lower row) over the entire brain. Dots and lines: red (left hemisphere) and blue (right hemisphere).
Official websites use .gov
A
.gov website belongs to an official
government organization in the United States.
Secure .gov websites use HTTPS
A lock (
) or https:// means you've safely
connected to the .gov website. Share sensitive
information only on official, secure websites.
Scatter plots for correlations between CT and CC (upper row), CT and CG (middle row), CG and CC (lower row) over the entire brain. Dots and lines: red (left hemisphere) and blue (right hemisphere).