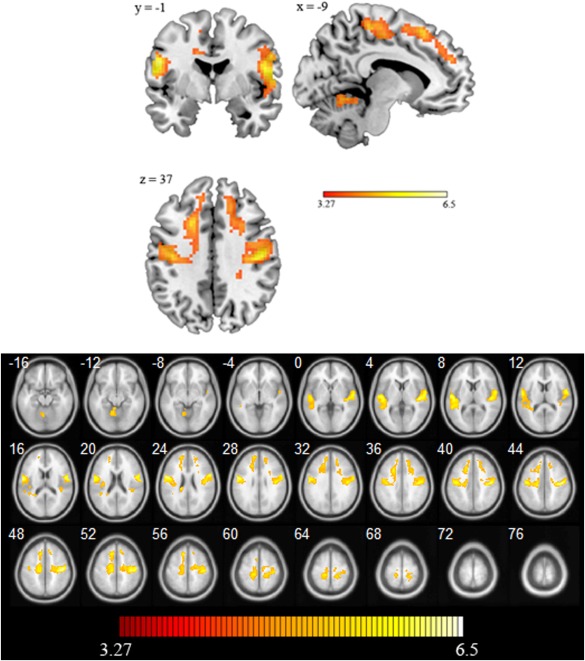
Figure 3.

Top panel: Activation map (urgent task > evaluative task) in orthogonal projection. Bottom panel: Statistical parametric maps showing enhanced neural activity for the urgent than for the evaluative task. Numbers indicate the z coordinate. The color scale showed the range of t‐test values.
