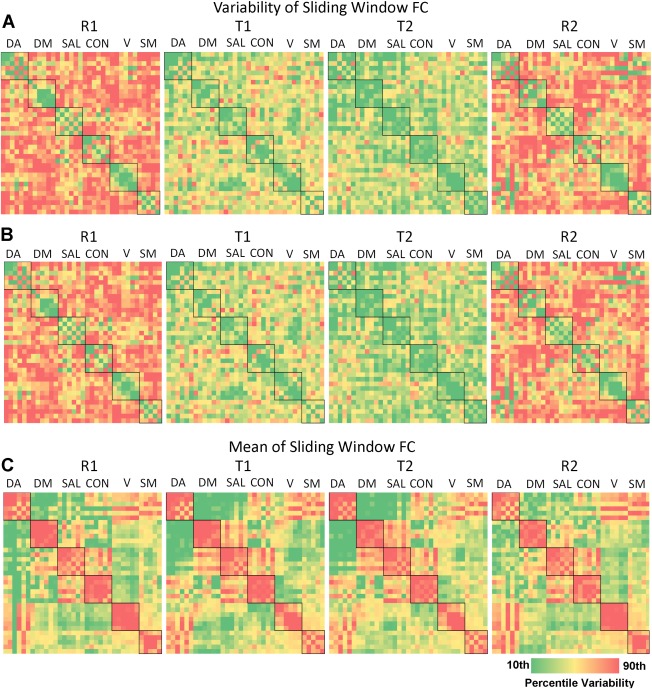
Figure 2.

Matrices of the effect of task on regional FCV. The (A) standard deviation, (B) power, and (C) mean of sliding window connectivity time series between each set of ROIs is displayed. Within‐network connectivity is denoted with a black box. Warm colors indicate greater variability. [Color figure can be viewed in the online issue, which is available at http://wileyonlinelibrary.com.]
